62%
Stick-side
Crease turns the chaos of a live game into a real record — where the shot came from, where it went, whether it was contested, whether it bounced. Built courtside, for the person actually keeping the book.
✕ save ◯ goal allowed — plotted exactly where it happened, mirrored for stick side
Outcome, contested or open, bounce or air, then tap the goal and the field. Crease is built to keep up with the game, not slow it down.
Every shot gets a real outcome — including wide shots that never reached the cage, tracked separately from save percentage.
Was a defender bearing down, or did the shooter have a clean look? The single biggest factor in how hard a shot really was.
Bounce shots are notoriously harder to read. Crease tracks the split so you can see it in the numbers, not just remember it.
Tap where a shot hit the goal, and where on the field it came from. Crease maps both to a normalized grid — high/mid/low, stick-side/center/off-stick — so the numbers hold up no matter which hand a goalie plays.
No mockups — this is Crease's own Stats tab: real save percentage broken down by zone, five-hole, and bounce vs. air, from a real logged season.
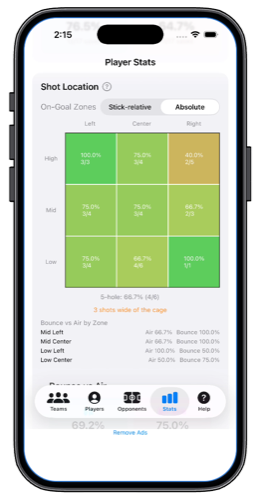
Every shot you log plots into this grid automatically — heat-shaded by save percentage, toggled between absolute and stick-relative, with five-hole and bounce/air called out separately.
This is the same chart whether you're looking at one game or a whole season — built from taps during live play, not typed in after the fact.
Opponent and tournament records build themselves from games you've already logged — no separate spreadsheet.
Link games to an opponent and their record, goals-by-period, and your goalie's stats against them build automatically. Group games into a tournament and track how the weekend actually went.
No account, no paywall on your data — it's yours, synced through your own iCloud. Premium clears the ads today, and unlocks everything we build next.